A Bernstein analyst recently put the world’s leading generic AI models to the test, asking them to perform like a real financial analyst. (See FT article here). The results were clear: ChatGPT, Gemini, Grok, Claude and their peers all failed to produce reliable models, insights or company reports. They could extract data and make charts. But they couldn’t think like analysts.
Asking generic LLMs to operate like an Analyst is like expecting a secondary school kid to behave like a university finance graduate. The former can have a general understanding of business, but the latter should be able to analyse a company or sector, build a financial model and write a draft report. This is the difference between generic AI and Credit Specialised AI.
Large Language Models (LLMs) like ChatGPT are fundamentally next-word text predictors trained on generic internet content. They’re brilliant at pattern recognition, summarising documents, and answering general questions.
But ask them to build a financial model, assign a rating, or justify a recommendation and things fall apart. Bernstein’s test showed that even with extensive prompts, high-quality data and detailed sector background, the models returned hallucinated numbers and broken spreadsheets.
Why? Because they aren’t trained on industry specific data and methodologies. They don’t have the rules, logic, and domain knowledge that underpin financial research.
“There are too many accounting nuances and country differences,” noted Bernstein’s Lead Analyst. Humans understand this. AI doesn’t, yet.
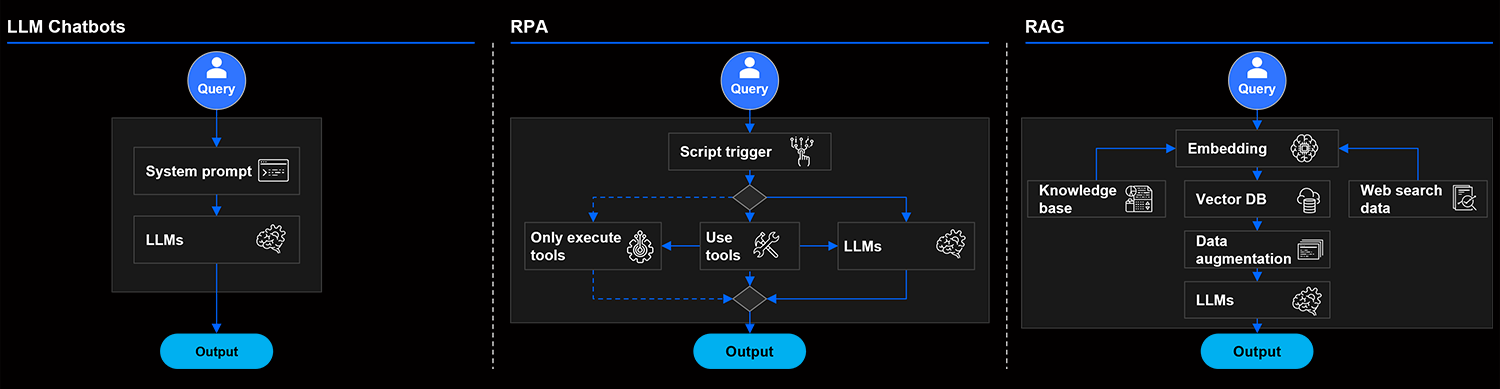
Below is an exhibit outlining three common approaches to prompting the LLM which fail to deliver humanlike Analyst outcomes.
Generic AI (non-Agentic AI)

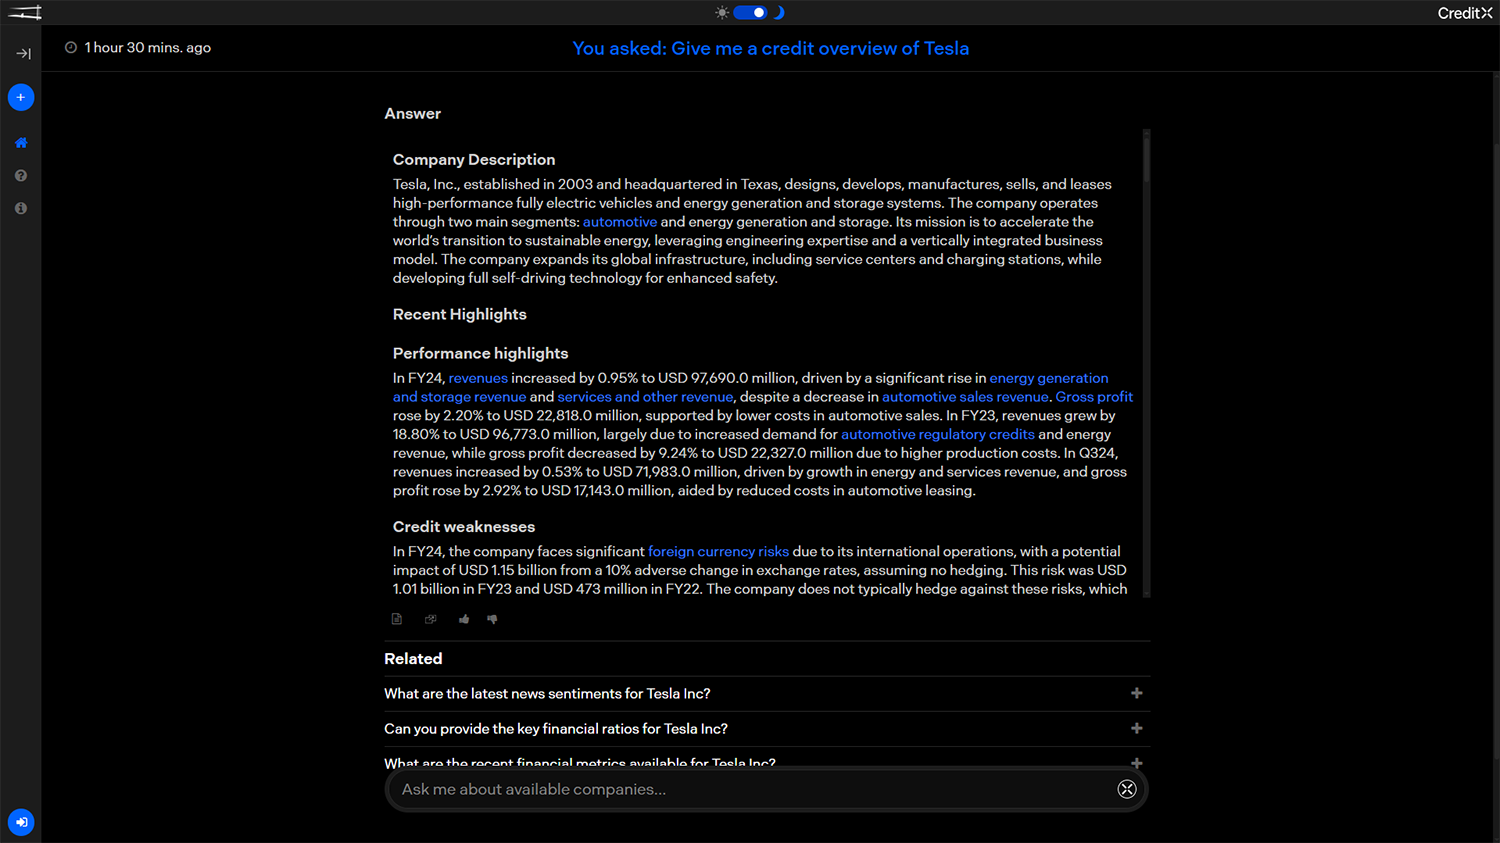
A Credit Specialised AI can mimic an Analyst’s thought process and create first draft outcomes for Analyst reviews of the same level as a finance major university graduate.
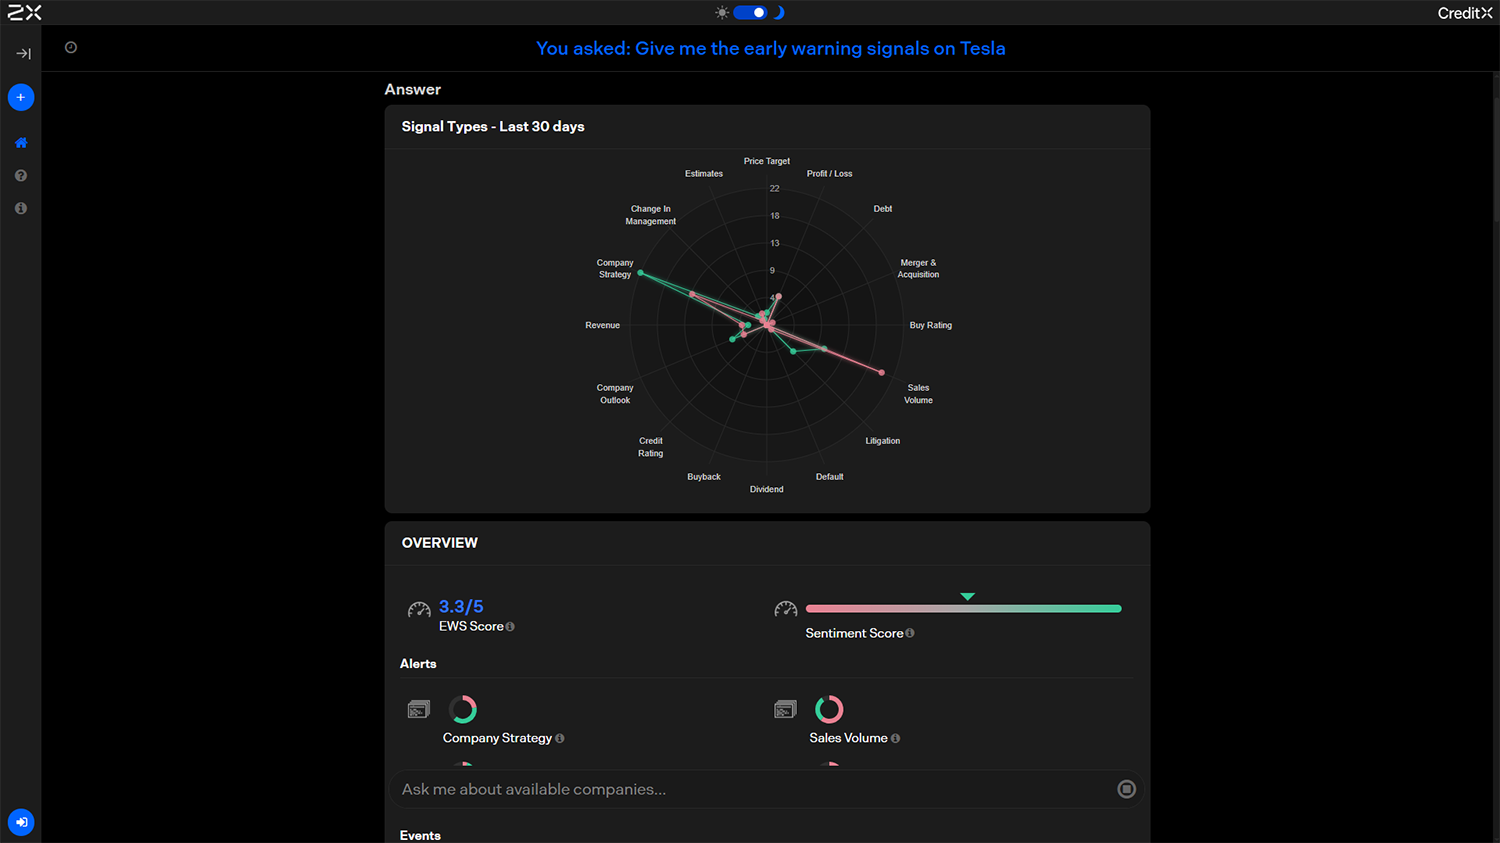
The specialised AI Agent can extract data from multiple sources across all formats, synthesise everything into positive/neutral/negative sentiment, listing out concerns that may impact credit risk and rating strength like management actions.
Early Warning Signals

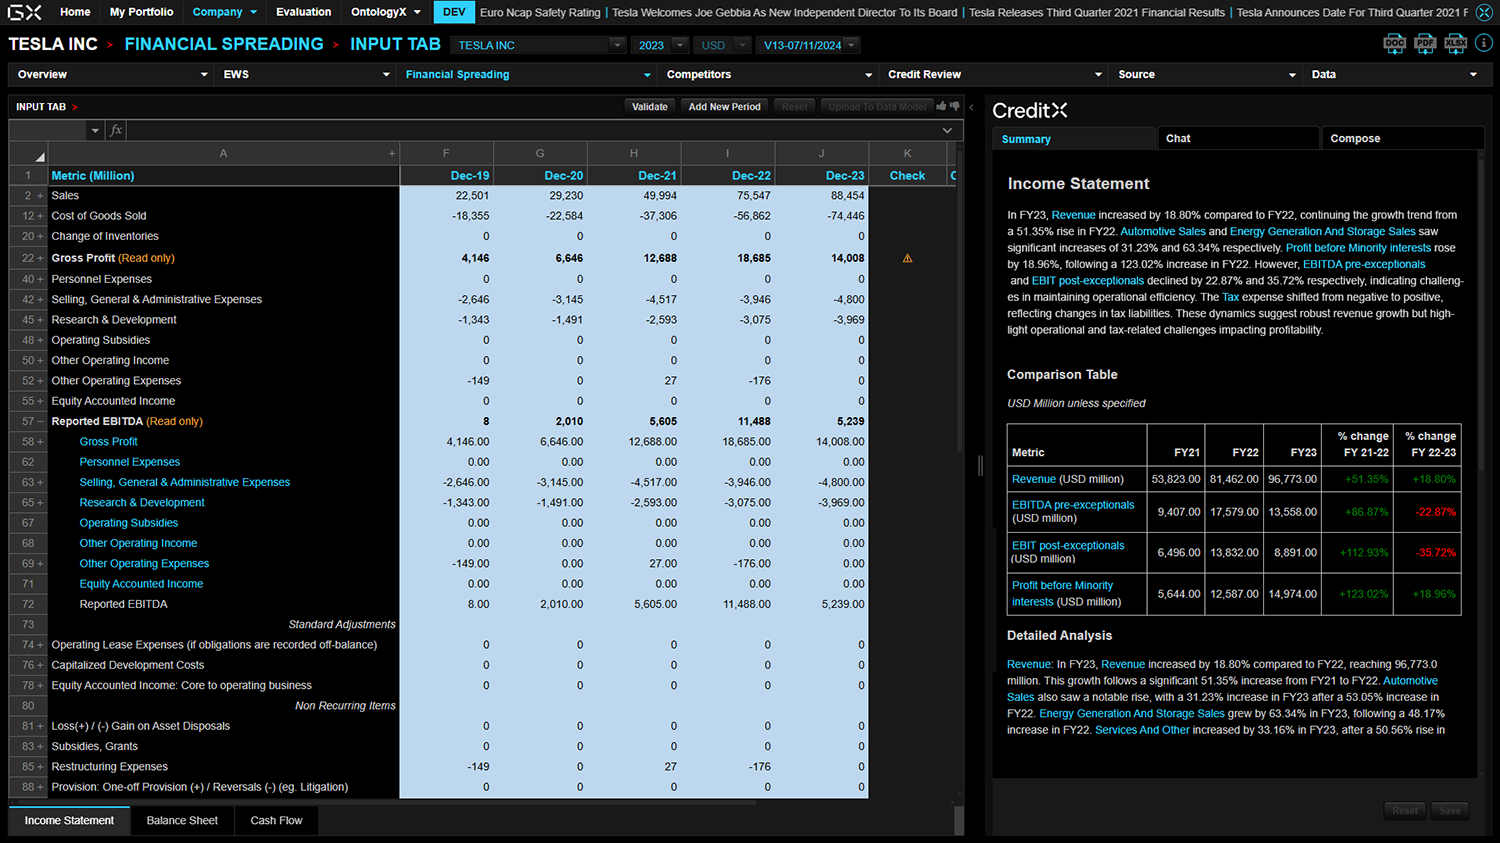
Using heterogeneous data and adding Analyst experience to long-term company performance analysis is core to an Analyst's role. Generic AI absolutely fails in creating meaningful models. However, Credit Specialised AI successfully generates meaningful and highly accurate models in spreadsheet format — explaining underpinning calculations and connecting to sources — effectively analysing the outlook for companies catering for accounting norms, managing for country-to-country differences and tackling different languages. This Specialised AI is built on credit domain centric learning to ensure it understands all the subtleties.
Financial Modelling

Forecast and Scenario Analysis

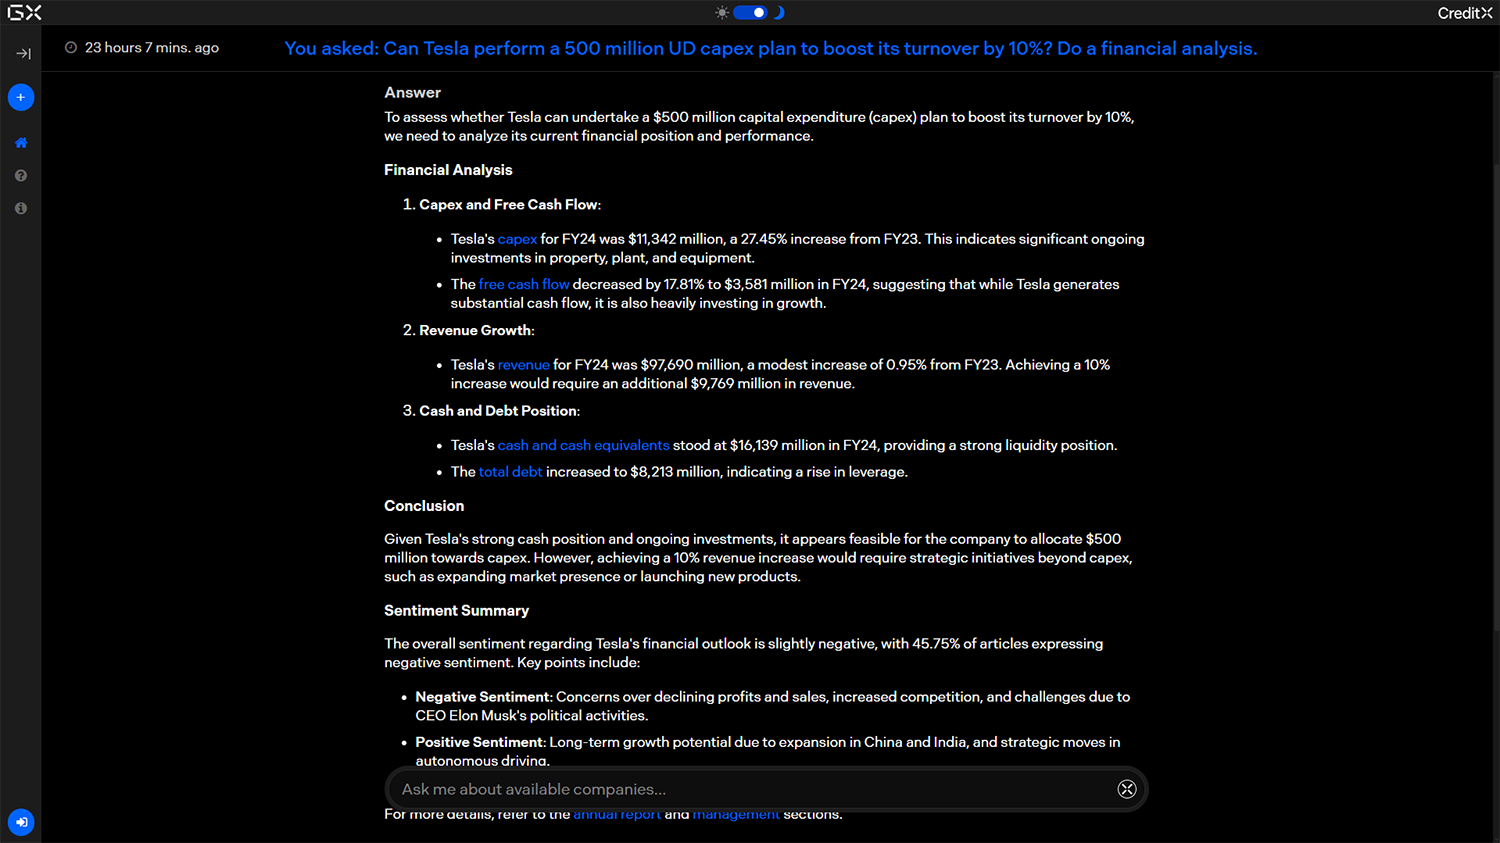
Analysing the outlook for companies and developing a detailed credit research report is again core to an Analyst’s role and something generic AI fails to solve. The Credit Specialised AI handles this task very effectively with in-depth reasoning and connectivity to source to ensure trust. It creates outcomes in-line with the Analyst’s expected modelling template, rules, logic and intent. It also tackles the hallucination problem by verifying all data sources and providing full traceability and auditability to the source.
First Draft Credit Memorandum. Please See the Full Draft Here.

Credit Specialised AI unlocks the full value of Analyst’s expertise with trust at its core.
Building a Credit Specialised AI takes time and requires three key ingredients:
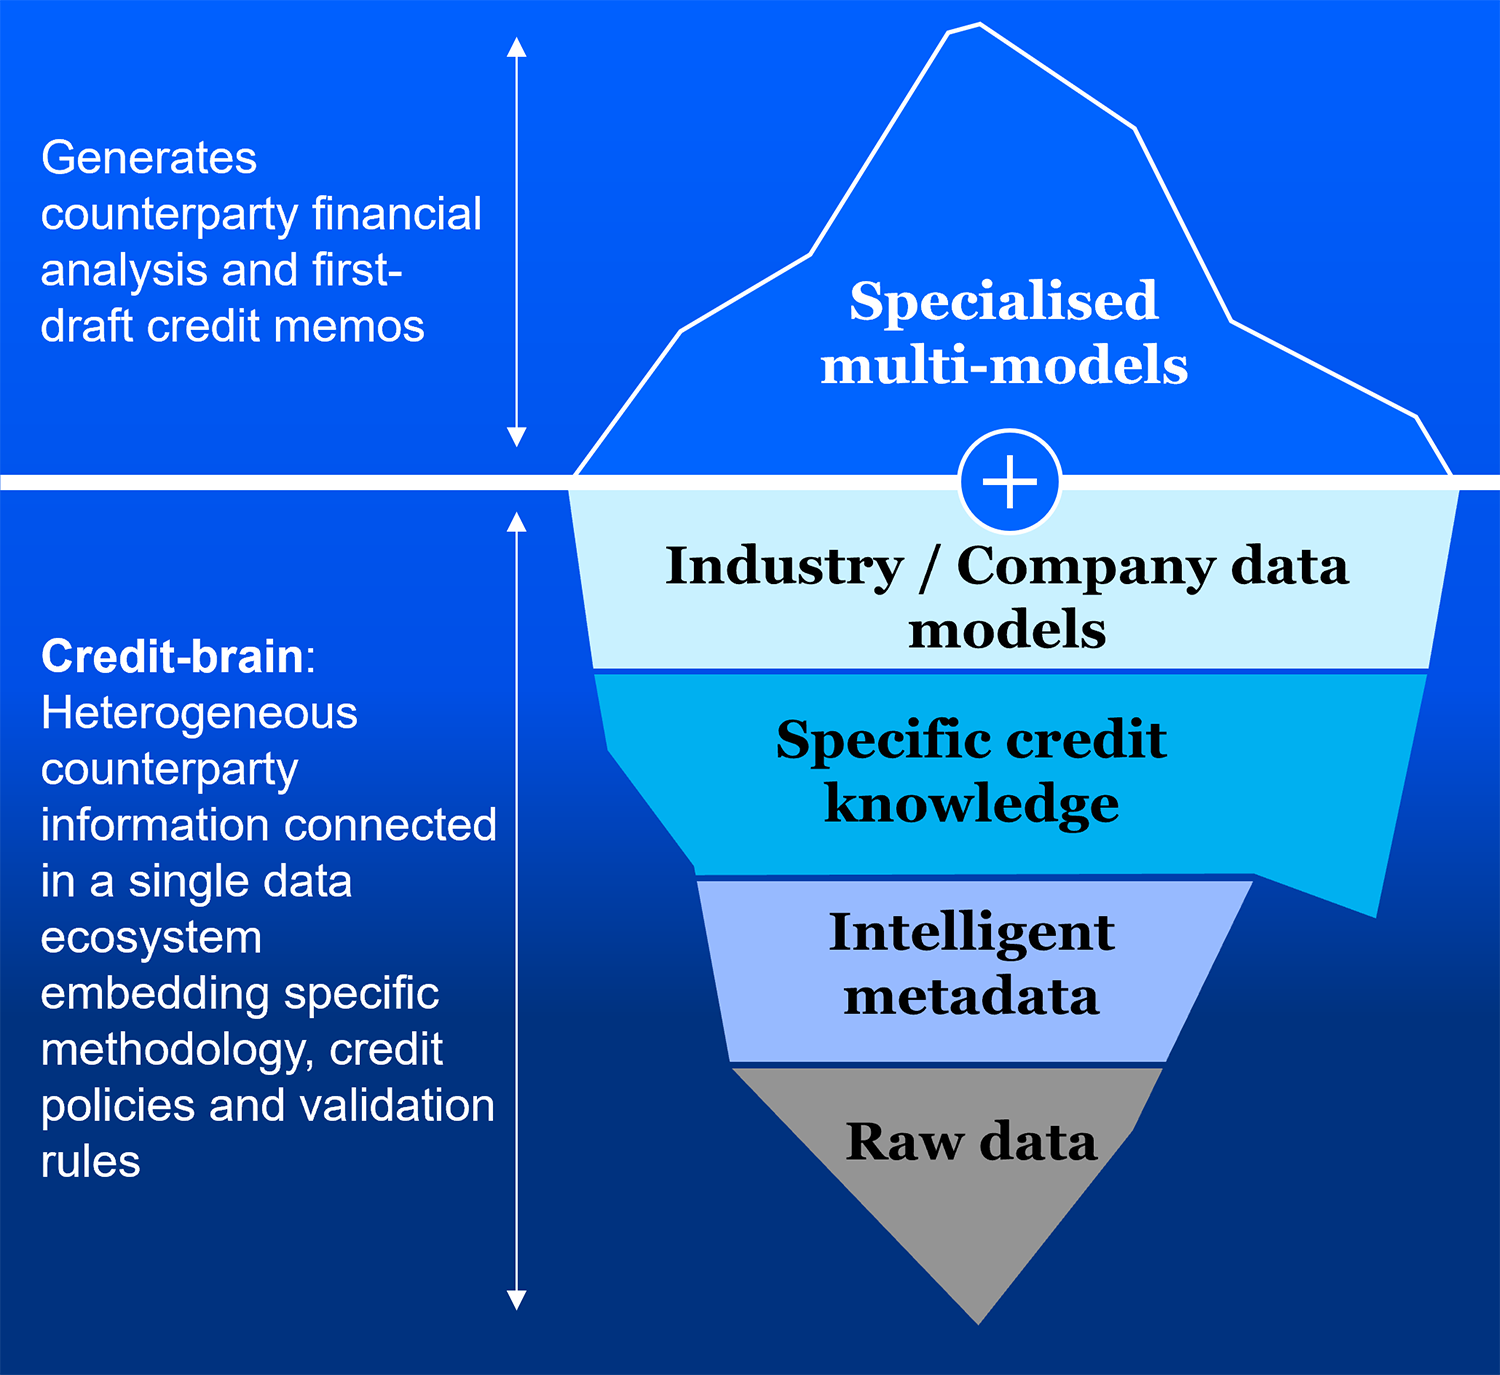
Specialised “Credit-brain” including credit content, knowledge, data and usage
Specialised Multi-Agentic architecture to train and fine-tune the models with a feedback loop
Specialised AI DataFactory combining algorithms with human supervision
A Specialised “Credit-brain” is the context in which the multi-agentic system works. It comprises different layers to handle raw data, extract credit knowledge from the raw data, harmonise and validate the data and finally populate data models for different companies or countries. Think modules of a graduate degree.
Specialised “Credit-Brain”

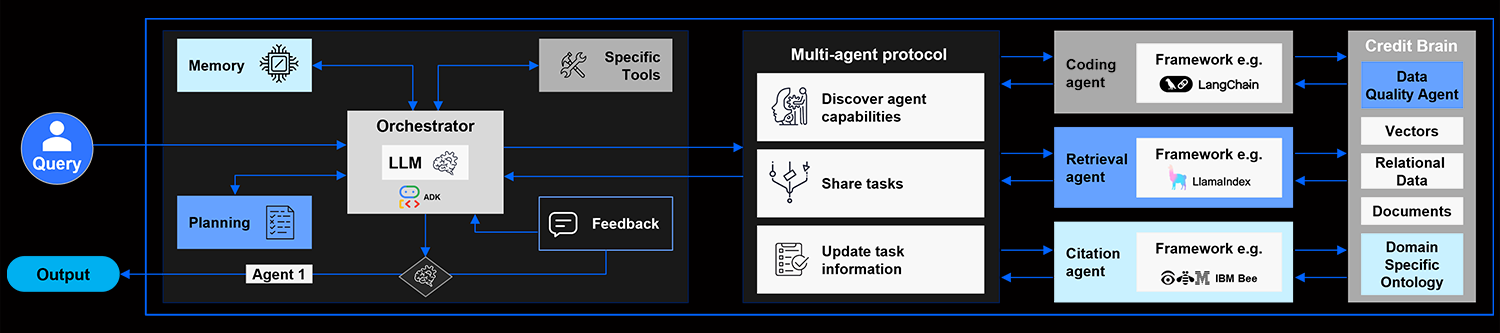
A Specialised Multi-Agentic architecture trains and fine-tunes models with a feedback loop. The system solves credit problems by applying a group of sub-AI Agents performing specialised tasks covering the data and credit lifecycle. For example, dedicated Ingestion Agents are trained to perform tasks related to ingestion of structured, unstructured and semi-structured data. Metadata Agents are used to tag data connecting data with knowledge e.g., the definition and computation of EBITDA. An Ontology Agent is used to embed credit rules and knowledge for a single company or a sector e.g. accounting rules, country by country differentiators by company. The Analytics Agent builds a financial model bringing together all the key financial metrics and ratios in line with defined rules and logic and with full traceability and connectivity to the source document or raw data. The Summary Agent composes a credit research report with in-depth reasoning providing a deep dive into why the numbers are moving and their implications for credit risk. Think of these agents representing different domains of expertise acquired via experience on the job.
Each of these highly specialised agents must be able to translate intent (expressed in natural language) into an execution plan, introspect and course correct during task execution, invoke tools, access persistent memory and enrich own context with relevant data. Critically, the agents must be able to learn and improve from human feedback.
Credit Specialised AI (Agentic AI)

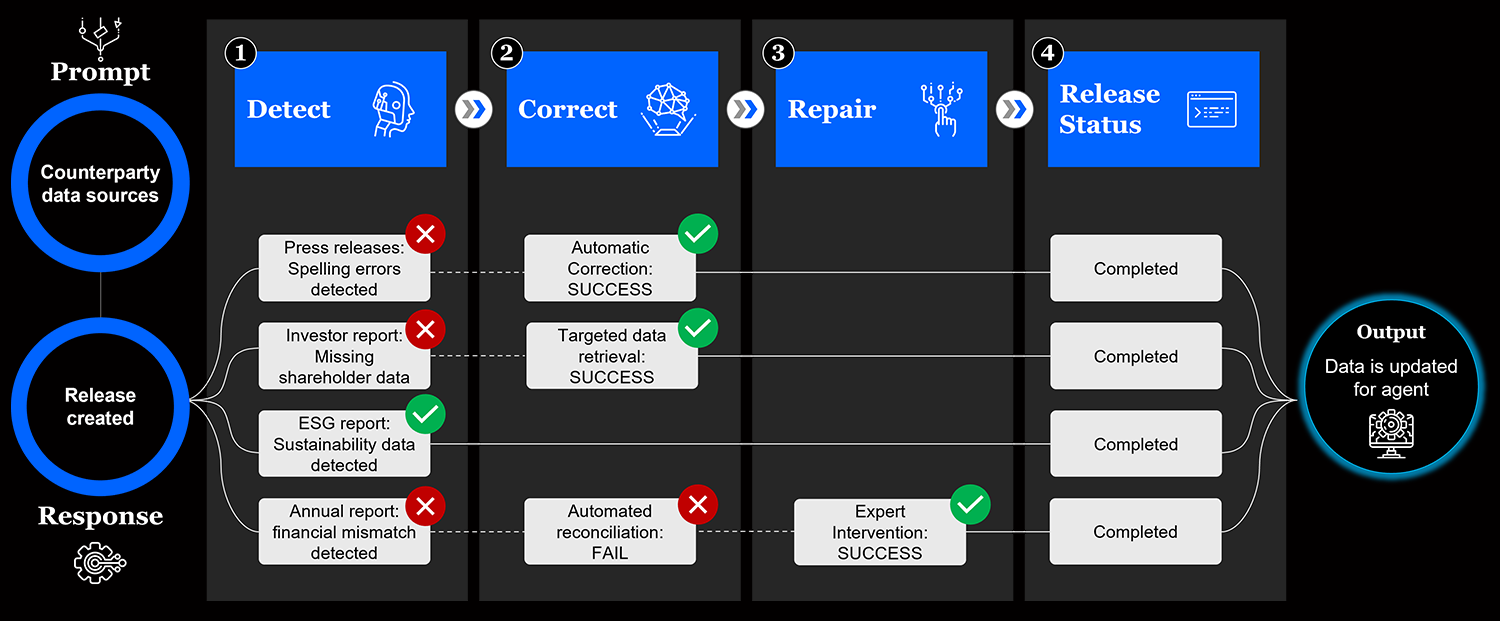
A Specialised AI DataFactory ensures trust, quality and relevance of insights generated by the Credit Agent. It supports the effective running of the Agents by combining algorithms with human feedback. The algorithms perform a Detect, Correct and Repair approach which is reenforced by expert oversight. Detection entails algorithmic recognition of errors; Correction entails automated fixing of errors; and Repair entails elevation of humans to supervisory roles, overseeing outcomes of AI agents and intervening via code to fix data issues arising from algorithmic processing. Human supervisors guide each stage of the process, enhancing the quality of company insights. Think graduate supervisor or manager.
Human Supervised Algorithmic Data Processing

The role of the analyst isn’t going away, it’s being upgraded.
With Credit Specialised AI doing the heavy lifting and delivering a foundation, analysts can focus efforts where they add their unique value and react more quickly than peers to credit events. They can truly deliver a risk-based approach with deeper analysis and improved decision-making on higher risk and more complex counterparts. They become a real first line of defence rather than spreadsheet processors and administrators.
The most important limitation of generic or specialised AI is the risk of over reliance. It is a way for Analysts to do their jobs better, but with a continued focus on individual accountability and using it as a tool to enhance what they are doing. Not to replace what they are doing.
And it’s not just the experienced Analysts who benefit. The technology will really improve the quality of the work of junior Analysts. They are going to get high-impact work while learning from the Specialised AI or getting it to other things.
One thing is for sure “If I was an analyst today, I would be using this tool day-in-day-out to make me smarter and deliver high-impact outcomes faster.”
Generic AI can’t write good Analyst research. It can’t model. It can’t reason. And it definitely can’t be trusted with risk.
Credit Specialised AI can.
Specialised AI delivers on the real promise of trustworthy automation, domain-specific insight and radical productivity gains.
“It ain’t what you don’t know that gets you into trouble. It’s what you know for sure that just ain’t so.” is a quote from Mark Twain.
And Generic AI knows for sure what just ain’t so — and that is a big problem for Analysts — the solution to this problem is Specialised AI.
This is not a future vision. It’s LIVE. In 30 plus global financial institutions.
Tesla, Inc., established in 2003 and headquartered in Texas, designs, develops, manufactures, sells, and leases high-performance fully electric vehicles and energy generation and storage systems. The company operates through two main segments: automotive and energy generation and storage. Its mission is to accelerate the world’s transition to sustainable energy, leveraging engineering expertise and a vertically integrated business model. The company expands its global infrastructure, including service centers and charging stations, while developing full self-driving technology for enhanced safety.
In FY24, revenues increased by 0.95% to USD 97,690.0 million, driven by a significant rise in energy generation and storage revenue and services and other revenue, despite a decrease in automotive sales revenue. Gross profit rose by 2.20% to USD 22,818.0 million, supported by lower costs in automotive sales. In FY23, revenues grew by 18.80% to USD 96,773.0 million, largely due to increased demand for automotive regulatory credits and energy revenue, while gross profit decreased by 9.24% to USD 22,327.0 million due to higher production costs. In Q324, revenues increased by 0.53% to USD 71,983.0 million, driven by growth in energy and services revenue, and gross profit rose by 2.92% to USD 17,143.0 million, aided by reduced costs in automotive leasing.
In FY24, the company faces significant foreign currency risks due to its international operations, with a potential impact of USD 1.15 billion from a 10% adverse change in exchange rates, assuming no hedging. This risk was USD 1.01 billion in FY23 and USD 473 million in FY22. The company does not typically hedge against these risks, which affects its operating results. Additionally, it is exposed to interest rate risk on its floating rate debt, with a hypothetical 10% change in interest rates potentially altering interest expenses by USD 2 million in FY21. These financial vulnerabilities, coupled with challenges in production ramp-up, supply chain management, and strong market competition, highlight the credit weaknesses impacting its operations and profitability.
Tesla, Inc., established in 2003 and headquartered in Texas, designs and manufactures electric vehicles and energy systems, operating through automotive and energy segments.
| ShareHolders Name | Shares Held | Shares Outstanding % |
|---|---|---|
| Elon Musk | 410,794,076 | 12.8 |
| Vanguard Fiduciary Trust Co. | 243,193,181 | 7.576 |
| BlackRock Advisors LLC | 153,685,950 | 4.788 |
| STATE STREET CORPORATION | 112,211,396 | 3.496 |
| Geode Capital Management LLC | 61,011,604 | 1.901 |
As of February 25, 2025, the top shareholders for Tesla include Elon Musk, who holds 410,794,076 shares, representing 12.8% of the shares outstanding. Vanguard Fiduciary Trust Co. follows with 243,193,181 shares, accounting for 7.58% of the shares outstanding, and BlackRock Advisors LLC holds 153,685,950 shares, which is 4.79% of the shares outstanding. This shareholding pattern indicates a significant concentration of ownership among these top shareholders, with Elon Musk having a substantial influence due to his large shareholding.
Tesla's top management includes Vaibhav Taneja, who serves as the Director of Finance and CFO. The company also has Thomas Zhu and Natasha Mahmoudian in roles as Corporate Officers/Principals. Additionally, Brandon Ehrhart holds the position of General Counsel.
The business risk profile of the company is influenced by challenges in scaling production due to supplier issues and the need for efficient manufacturing processes across its global facilities. Its growth strategy depends on increasing mass-market vehicle production, necessitating significant lithium-ion battery cell production and partnerships with suppliers. The company faces competition from both established and new entrants in the electric vehicle market, impacting market share and profitability. Additionally, it is subject to various regulatory, political, and economic conditions globally, affecting product sales and cost management. For more insights, refer to the annual report and additional context.
In FY24, Tesla's diversification and scale efforts were evident as it produced approximately 1,773,000 consumer vehicles and delivered about 1,789,000 vehicles, focusing on leveraging existing factories for new, affordable products and expanding global infrastructure. The energy storage products deployment reached 31.4 GWh, emphasizing production ramp-up and market penetration. Total revenues were USD 97.69 billion, up by USD 917 million from the previous year, while net income decreased by USD 7.91 billion due to a significant tax-related valuation allowance release. Cash and investments increased by USD 7.47 billion, totaling USD 36.56 billion.
The company leverages its engineering expertise and vertically integrated business model to differentiate itself in the competitive electric vehicle and energy sectors. It emphasizes performance, styling, and safety, while developing full self-driving technology. The firm aims to lower ownership costs by reducing manufacturing expenses and offering tailored financial services. It faces competition from both established and new manufacturers in the automotive market and from various players in the energy sector. For more details, refer to Tesla's annual report and competition analysis.
The auditor's opinion for TESLA is unqualified, as the auditor's report indicates that the company has maintained effective internal control over financial reporting as of December 31, 2023, based on criteria established by the Committee of Sponsoring Organizations of the Treadway Commission (COSO) (source). The financial statements were audited by PricewaterhouseCoopers LLP, which has been the auditor since 2005, ensuring a fair view and sufficient information for stakeholders. The management's responsibility includes maintaining effective internal controls, which is crucial for the audit committee's oversight. The applicable accounting standards include the criteria established by COSO, reflecting the company's commitment to transparency and accuracy in financial reporting.
USD Million unless specified
| Metric | FY24 | FY23 | FY22 | 3Q24 |
|---|---|---|---|---|
| Total Debt | 8,213.00 | 5,230.00 | 3,099.00 | 7,696.00 |
| Long - term debt and financial lease | 5,757.00 | 2,857.00 | 1,597.00 | 5,405.00 |
| Current portion of long - term debt and financial lease | 2,456.00 | 2,373.00 | 1,502.00 | 2,291.00 |
| Total Equity | 73,680.00 | 63,609.00 | 45,898.00 | 70,710.00 |
USD Million unless specified
| Metric | FY24 | FY23 | FY22 | 3Q24 |
|---|---|---|---|---|
| Total Debt / Equity (x) | 0.11 | 0.08 | 0.07 | 0.11 |
| Total Debt / Total Capital (x) | 0.10 | 0.08 | 0.06 | 0.10 |
In FY24, the Total Debt / Equity ratio increased to 0.11, and the Total Debt / Total Capital ratio rose to 0.10, driven by a rise in total debt and finance leases to USD 5,757 million, with significant contributions from automotive asset-backed notes and the China Working Capital Facility. In FY23, the Total Debt / Equity ratio was 0.08, and the Total Debt / Total Capital ratio was 0.07, attributed to an increase in total liabilities to USD 3,777 million, driven by higher current and long-term debt and finance leases. In Q324, the Total Debt / Equity ratio was 0.10, and the Total Debt / Total Capital ratio was 0.09, reflecting current liabilities of USD 1,973 million and total debt and finance leases of USD 5,405 million, with a notable increase in non-recourse debt.
The company faces currency and interest rate risks due to its global operations and reliance on international suppliers and markets. Fluctuations in foreign exchange rates can impact the cost of production and profitability, especially with facilities in China and Germany. Additionally, changes in interest rates could affect the cost of financing for expansion and production ramp-up. Managing these risks is crucial for maintaining competitive pricing and profitability in the electric vehicle market. Source Source.
In FY24, the potential impact of a 10% adverse change in exchange rates on net income was USD 1.15 billion, compared to USD 1.01 billion in FY23 and USD 473 million in FY22, indicating significant foreign exchange rate risk. The company does not typically hedge against these foreign currency risks, which can significantly impact its financials. Additionally, it faced interest rate risk on floating rate debt, potentially altering interest expense by USD 2 million in FY21.
USD Million unless specified
| Metric | FY24 | FY23 | FY22 | 3Q24 | 3Q23 |
|---|---|---|---|---|---|
| Revenues | 97,690.00 | 96,773.00 | 81,462.00 | 71,983.00 | 71,606.00 |
| Gross Profit | 22,818.00 | 22,327.00 | 24,600.00 | 17,143.00 | 16,657.00 |
| Gross Margin (%) | 23.36 | 23.07 | 30.20 | 23.82 | 23.26 |
| EBITDA | 12,444.00 | 13,558.00 | 17,403.00 | 9,365.00 | 10,262.00 |
| EBITDA Margin (%) | 12.74 | 14.01 | 21.36 | 13.01 | 14.33 |
| Net Profit/Loss | 7,153.00 | 14,974.00 | 12,587.00 | 4,821.00 | 7,031.00 |
| Net Margin (%) | 7.32 | 15.47 | 15.45 | 6.70 | 9.82 |
In FY24, revenues increased by 0.95% to USD 97,690.0 million, driven by a significant rise in energy generation and storage revenue and services and other revenue, despite a decrease in automotive sales revenue. The gross margin rose by 1.24% due to lower raw material costs, while the EBITDA margin fell by 9.08% due to increased Cybertruck costs. The net margin decreased by 52.68% due to the previous year's tax asset valuation allowance release. In FY23, revenues grew by 18.80% to USD 96,773.0 million, driven by increased demand for automotive regulatory credits and energy revenue. The gross margin decreased by 23.60% due to lower vehicle selling prices, while the EBITDA margin fell by 34.42% due to lower automotive sales and higher operational costs. The net margin slightly increased by 0.14% due to the release of deferred tax asset valuation allowance. In Q324, revenues rose by 0.53% to USD 71,983.0 million, driven by higher energy and services revenue. The gross margin increased by 2.38% due to lower vehicle costs and increased FSD revenue, while the EBITDA margin decreased by 9.22% due to lower automotive sales and higher operational costs. The net margin decreased by 31.79% due to lower net income attributable to common stockholders.
USD Million unless specified
| Metric | FY24 | FY23 | FY22 | 3Q24 |
|---|---|---|---|---|
| Cash and cash equivalents | 16,139.00 | 16,398.00 | 16,253.00 | 18,111.00 |
| Undrawn Committed Debt | 5,000.00 | 5,000.00 | 5,000.00 | 5,000.00 |
In FY24, cash and cash equivalents decreased by 1.58% YoY to USD 16,139.0 million, attributed to a reduction in U.S. government securities and corporate debt securities, as detailed here. Undrawn Committed Debt remained stable at USD 5,000.0 million due to the RCF Credit Agreement, as mentioned here. In FY23, cash and cash equivalents increased by 0.89% YoY to USD 16,398.0 million, driven by higher balances in certificates of deposit and time deposits, as detailed here. Undrawn Committed Debt was unchanged at USD 5,000.0 million due to the RCF Credit Agreement, as mentioned here. In Q324, cash and cash equivalents rose to USD 18,111.0 million due to higher balances in money market funds and commercial paper, as detailed here. Undrawn Committed Debt remained stable at USD 5,000.0 million due to the RCF Credit Agreement, as mentioned here.
USD Million unless specified
| Metric | FY24 | FY23 | FY22 | 3Q24 | 3Q23 |
|---|---|---|---|---|---|
| Total Changes in Working Capital | 81.00 | -2,248.00 | -3,712.00 | -949.00 | -2,730.00 |
| Net Cash Flow from Operating Activities | 14,923.00 | 13,256.00 | 14,724.00 | 10,109.00 | 8,886.00 |
| Capex, net | -11,342.00 | -8,899.00 | -6,236.00 | -8,562.00 | -6,592.00 |
| Free cash Flow (FCF) | 3,581.00 | 4,357.00 | 8,488.00 | 1,547.00 | 2,294.00 |
USD Million unless specified
| Metric | FY24 | FY23 | FY22 | 3Q24 | 3Q23 |
|---|---|---|---|---|---|
| NOCF / Revenue % | 15.28 | 13.7 | 18.07 | 14.04 | 12.41 |
| (Cash + Credit lines) / ST debt (x) | 8.61 | 9.02 | 14.15 | 10.09 | 0 |
USD Million unless specified
| Metric | FY24 | FY23 | FY22 | 3Q24 | 3Q23 |
|---|---|---|---|---|---|
| Interest Coverage Ratio (x) | 35.55 | 86.91 | 91.12 | 36.87 | 108.02 |
| Total Debt / EBITDA (x) | 0.66 | 0.39 | 0.18 | 0.82 | 0 |
| Net Debt / EBITDA (x) | -0.64 | -0.82 | -0.76 | -1.11 | 0 |
| Debt Service Coverage Ratio (x) | 35.55 | 86.91 | 91.12 | 36.87 | 108.02 |
| Total Debt / Equity (x) | 0.11 | 0.08 | 0.07 | 0.11 | 0 |
| Total Debt / Total Capital (x) | 0.10 | 0.08 | 0.06 | 0.10 | 0 |
In FY24, Net Cash Flow from Operating Activities increased by 12.58% to USD 14,923.0 million, driven by higher revenues and operational efficiencies despite tax-related net income reductions as noted in the strategy document. Capex, net rose by 27.45% to USD -11,342.0 million due to investments in property, plant, and equipment, while Free Cash Flow (FCF) decreased by 17.81% to USD 3,581.0 million due to increased capital expenditures. In FY23, Net Cash Flow from Operating Activities decreased by 9.97% to USD 13,256.0 million due to lower net income, while Capex, net increased by 42.70% to USD -8,899.0 million due to investments in property, plant, and equipment. Free Cash Flow (FCF) decreased by 48.67% to USD 4,357.0 million due to increased capital expenditures and lower operating cash flows. In Q324, Net Cash Flow from Operating Activities increased by 13.76% to USD 10,109.0 million due to improved operational efficiencies and higher revenues, while Capex, net increased by 29.88% to USD -8,562.0 million due to ongoing investments in property, plant, and equipment. Free Cash Flow (FCF) decreased by 32.56% to USD 1,547.0 million due to increased capital expenditures despite higher operating cash flows.
USD Million unless specified
| Metric | Tesla | Average | Paccar Inc | Ford Motor Company | General Motors | Li Auto Inc |
|---|---|---|---|---|---|---|
| Earnings before interest and taxes, depreciation and amortisation (EBITDA) | 12,444.00 | 10,900.67 | 6,048.00 | 11,086.00 | 25,173.00 | 1,295.69 |
| Free cash Flow (FCF) | 3,581.00 | 6,426.51 | 3,495.00 | 6,739.00 | 9,297.00 | 6,175.04 |
| Revenues | 97,690.00 | 106,044.75 | 34,324.80 | 184,992.00 | 187,442.00 | 17,420.19 |
| Total Debt | 8,213.00 | 75,928.84 | 14,234.50 | 158,522.00 | 129,732.00 | 1,226.85 |
| Total Equity | 73,680.00 | 33,711.74 | 15,878.80 | 44,858.00 | 65,590.00 | 8,520.15 |
In FY24, Tesla's revenue was USD 97,690.00 million, below the average of USD 106,044.75 million, but higher than Paccar Inc and Li Auto Inc. Its total debt was USD 8,213.00 million, significantly lower than the peer average of USD 75,928.84 million, indicating a conservative debt position. Tesla's total equity was USD 73,680.00 million, much higher than the average of USD 33,711.74 million, reflecting strong equity. The company's free cash flow was USD 3,581.00 million, below the average of USD 6,426.51 million. Tesla's strategic focus on expanding product offerings and market presence, along with its innovative revenue strategies, contributes to its financial positioning. For more details, refer to the annual report, management, and overview sections.